This function plots the lineup.
Arguments
- dat
Data frame. A data frame containing correspoding variables.
- type
Character. "resid": VI_MODEL$plot_resid. Default is
type = "resid".- ...
Arguments passed to VI_MODEL$plot
Examples
# Instantiate
x <- rand_uniform()
e <- rand_normal()
test <- vi_model(prm = list(x = x, e = e),
prm_type = list(x = "r", e = "r"),
formula = y ~ 1 + x + 10 * x^2 + e,
null_formula = y ~ x,
alt_formula = y ~ x + I(x^2))
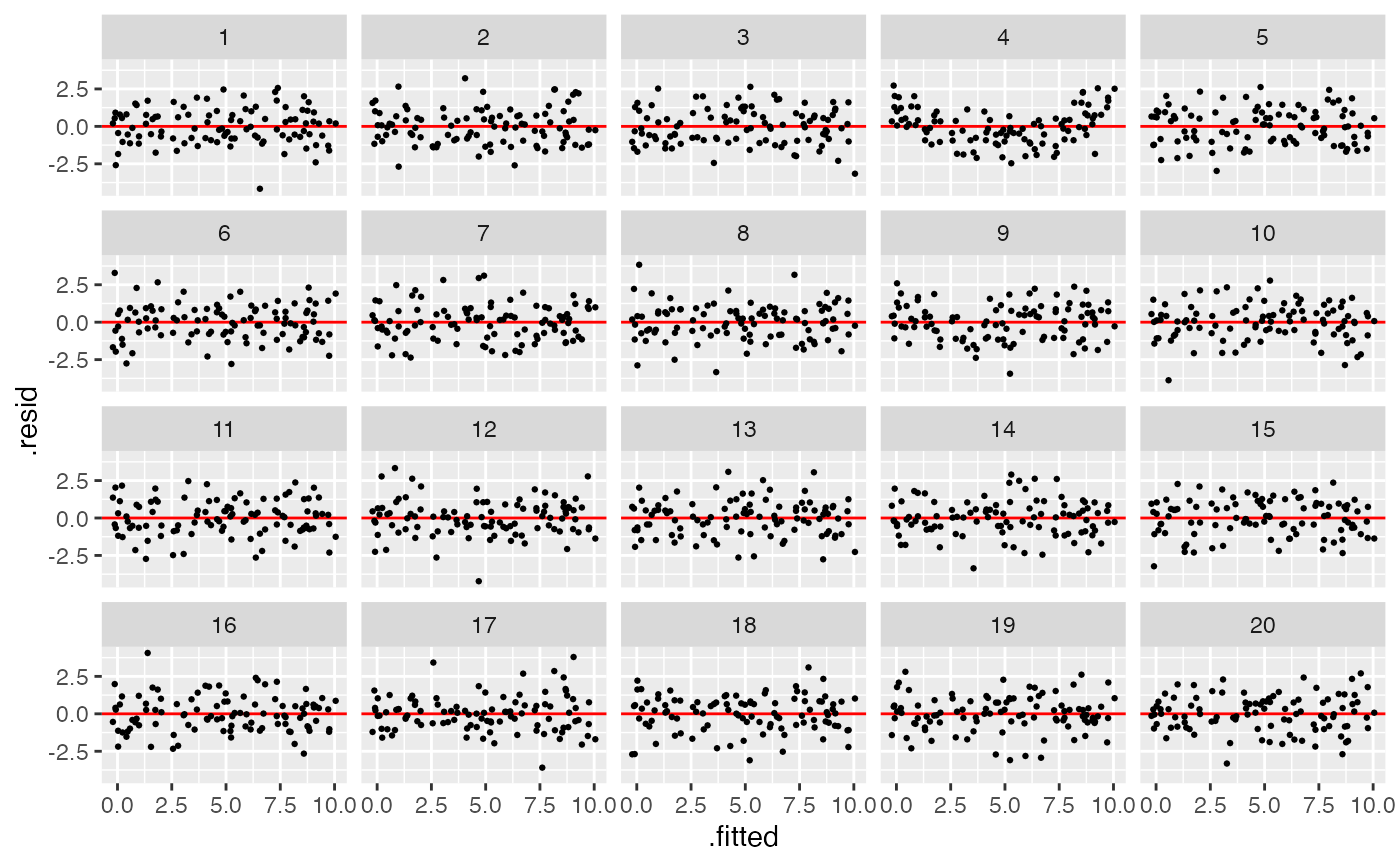
# Lineup of residual plots
test$plot_lineup(test$gen_lineup(100), type = "resid")
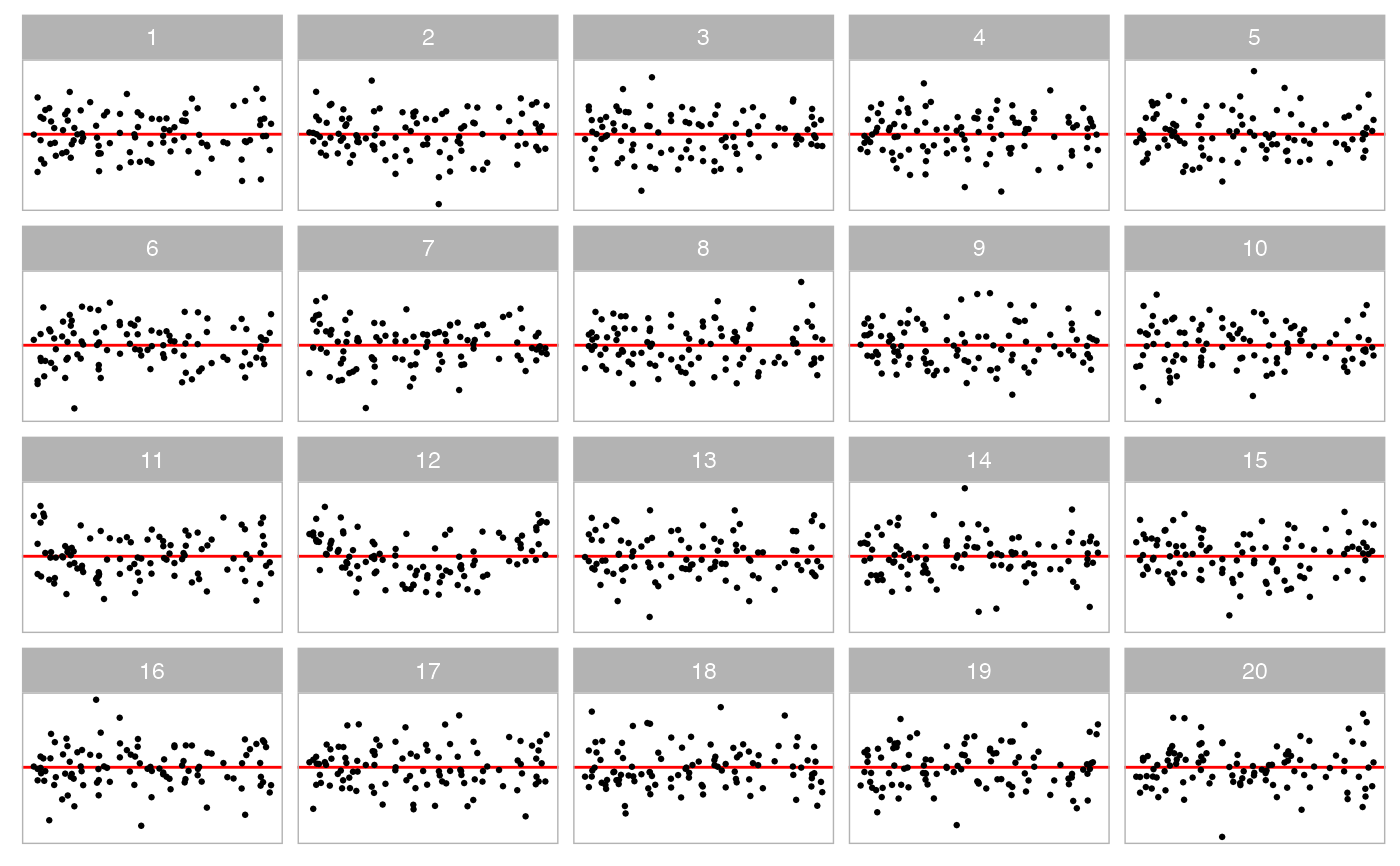
 # Customize the plot
test$plot_lineup(test$gen_lineup(100),
type = "resid",
theme = ggplot2::theme_light(),
remove_axis = TRUE,
remove_grid_line = TRUE,
add_zero_line = TRUE)
# Customize the plot
test$plot_lineup(test$gen_lineup(100),
type = "resid",
theme = ggplot2::theme_light(),
remove_axis = TRUE,
remove_grid_line = TRUE,
add_zero_line = TRUE)