This function generates plot for fitted model.
Arguments
- dat
Data frame. A data frame containing correspoding variables.
- type
Character. "resid": VI_MODEL$plot_resid. Default is
type = "resid".- theme
ggtheme. A ggplot theme object.
- alpha
Numeric. Alpha of dot. Value between 0 and 1. Default is 1.
- size
Numeric. Size of dot. Value between 0 and 1. Default is 0.5.
- stroke
Numeric. Stroke of dot. Default is 0.5.
- remove_axis
Boolean. Whether or not to remove the axis. Default is
remove_axis = FALSE.- remove_legend
Boolean. Whether or not to remove the legend. Default is
remove_legend = FALSE.- remove_grid_line
Boolean. Whether or not to remove the grid lines. Default is
remove_grid_line = FALSE.- add_zero_line
Boolean. Whether or not to add a zero horizontal line. Default is
add_zero_line = TRUE.
Examples
# Instantiate
x <- rand_uniform()
e <- rand_normal()
test <- vi_model(prm = list(x = x, e = e),
prm_type = list(x = "r", e = "r"),
formula = y ~ 1 + x + 10 * x^2 + e,
null_formula = y ~ x,
alt_formula = y ~ x + I(x^2))
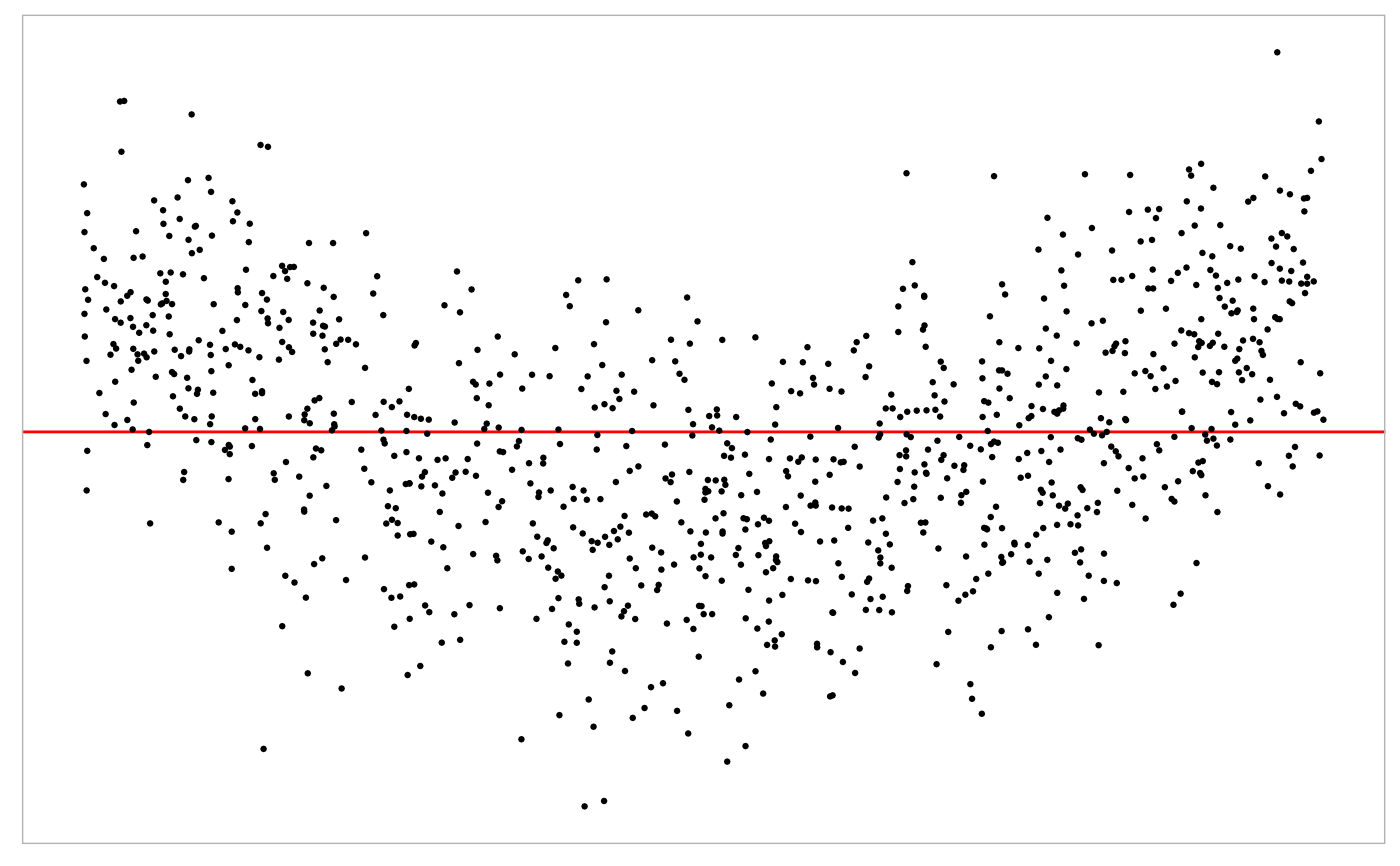
# Residual plot of the null model
test$plot(test$gen(1000, fit_model = TRUE), type = "resid")
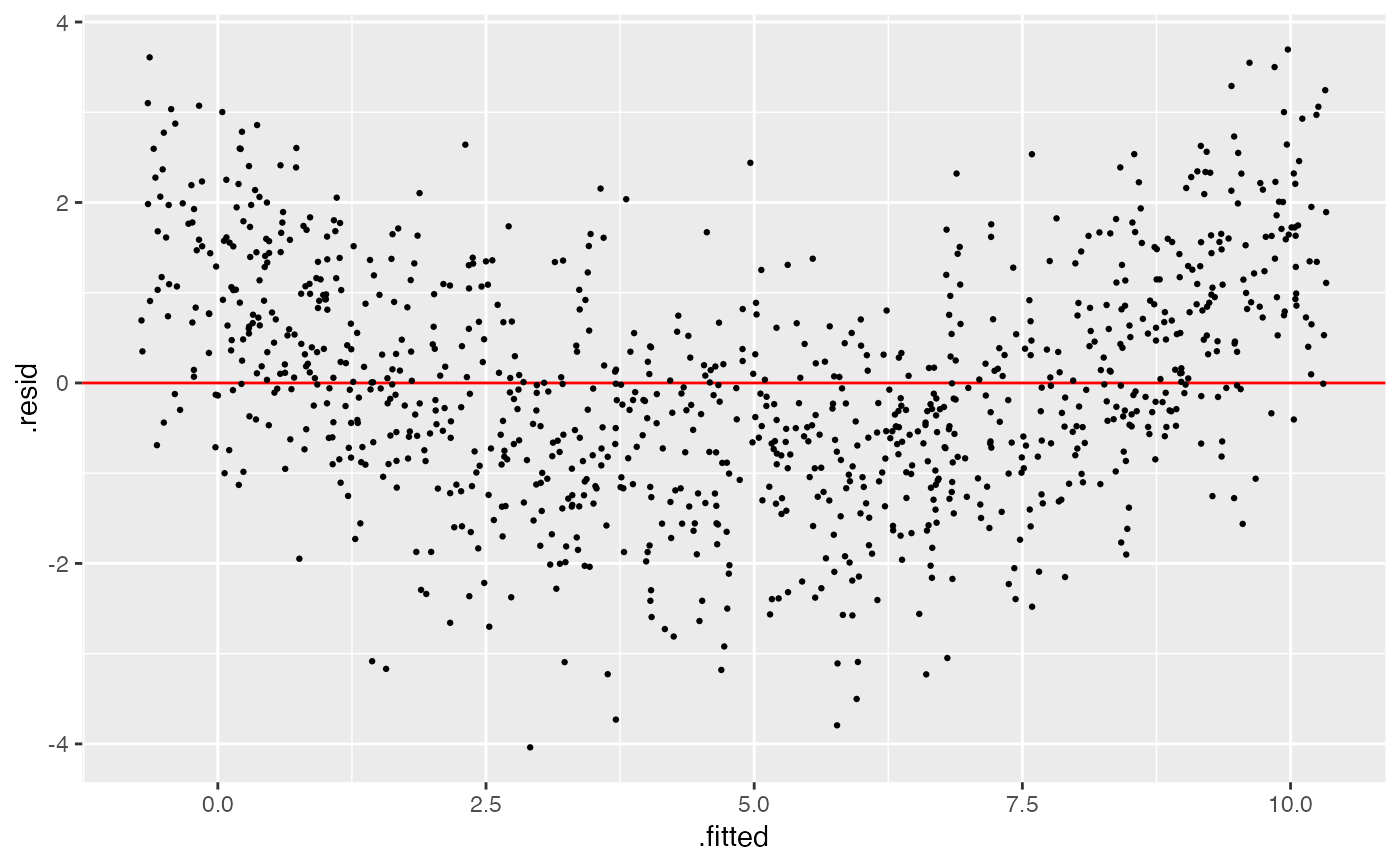 # Customize the plot
test$plot(test$gen(1000, fit_model = TRUE),
type = "resid",
theme = ggplot2::theme_light(),
remove_axis = TRUE,
remove_grid_line = TRUE,
add_zero_line = TRUE)
# Customize the plot
test$plot(test$gen(1000, fit_model = TRUE),
type = "resid",
theme = ggplot2::theme_light(),
remove_axis = TRUE,
remove_grid_line = TRUE,
add_zero_line = TRUE)