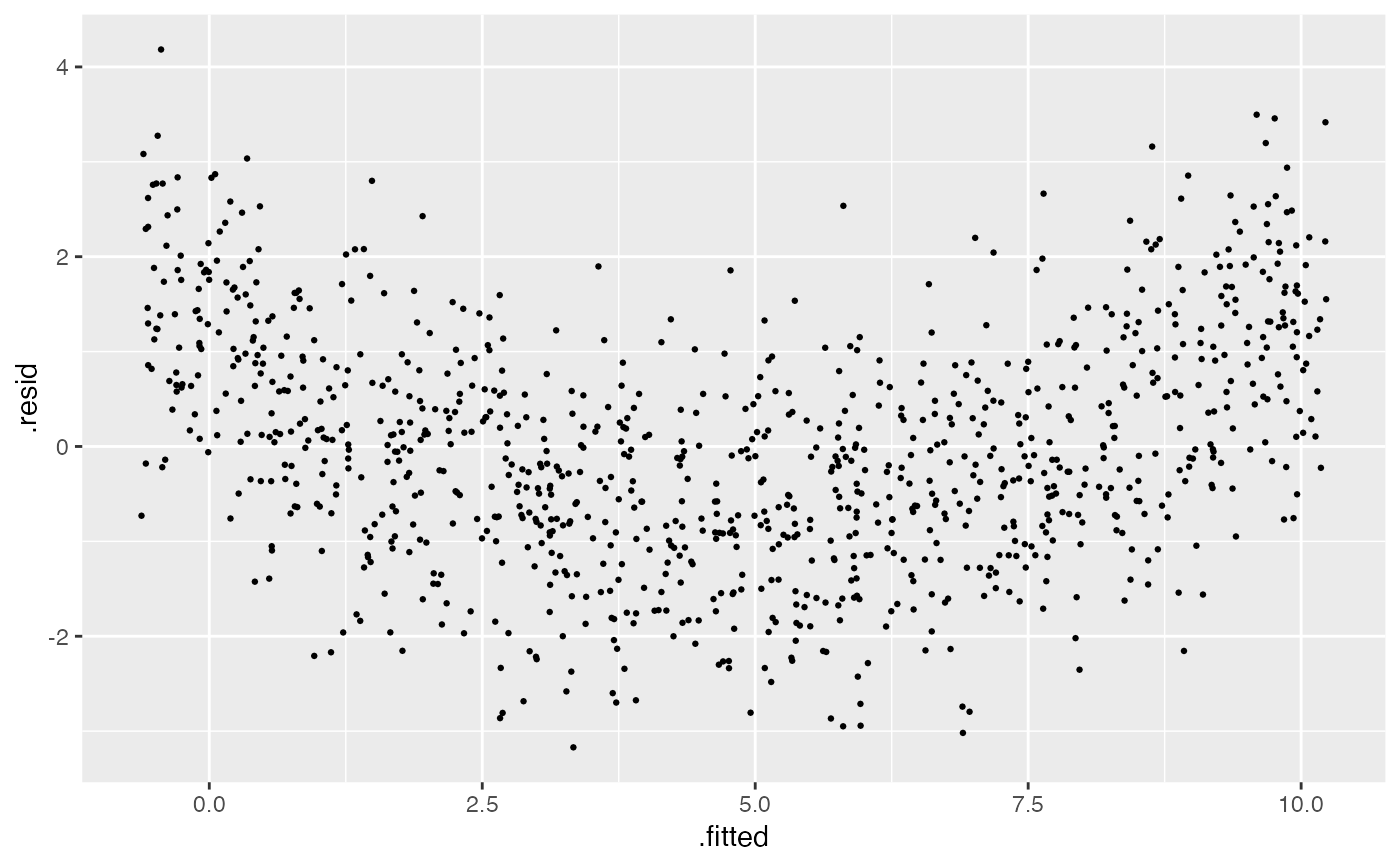
This function generate a residuals vs fitted values plot.
Arguments
- dat
Data frame. A data frame containing
.residand.fitted.- alpha
Numeric. Alpha of dot. Value between 0 and 1.
- size
Numeric. Size of dot. Value between 0 and 1. Default is 0.5.
- stroke
Numeric. Stroke of dot. Default is 0.5.
Examples
# Instantiate
x <- rand_uniform()
e <- rand_normal()
test <- vi_model(prm = list(x = x, e = e),
                 prm_type = list(x = "r", e = "r"),
                 formula = y ~ 1 + x + 10 * x^2 + e,
                 null_formula = y ~ x,
                 alt_formula = y ~ x + I(x^2))

# Residual plot of the null model
test$plot_resid(test$gen(1000, fit_model = TRUE))