This function takes a spotoroo object to produce a plot of the
clustering results. It can be called by plot.spotoroo().
Usage
plot_spotoroo(
  result,
  type = "def",
  cluster = "all",
  hotspot = TRUE,
  noise = FALSE,
  ignition = TRUE,
  from = NULL,
  to = NULL,
  step = 1,
  mainBreak = NULL,
  minorBreak = NULL,
  dateLabel = NULL,
  bg = NULL
)
Arguments
- result
spotorooobject. A result of a call tohotspot_cluster().- type
Character. Type of the plot. One of "def" (default), "timeline" (timeline) and "mov" (fire movement).
- cluster
Character/Integer. If "all", plot all clusters. If an integer vector is given, plot corresponding clusters. Unavailable in
plot_timeline().- hotspot
Logical. If
TRUE, plot the hot spots. Unavailable inplot_timeline().- noise
Logical. If
TRUE, plot the noise. Only used inplot_def().- ignition
Logical. If
TRUE, plot the ignition points. Only used inplot_def().- from
OPTIONAL. Date/Datetime/Numeric. Start time. The data type needs to be the same as the provided observed time.
- to
OPTIONAL. Date/Datetime/Numeric. End time. The data type needs to be the same as the provided observed time.
- step
Integer (>=0). Step size used in the calculation of the fire movement. Only used in
plot_fire_mov().- mainBreak
OPTIONAL. Character/Numeric. A string/value giving the difference between major breaks. If the observed time is in date/datetime format, this value will be passed to
ggplot2::scale_x_date()orggplot2::scale_x_datetime()asdate_breaks. Only used inplot_timeline().- minorBreak
OPTIONAL. Character/Numeric. A string/value giving the difference between minor breaks. If the observed time is in date/datetime format, this value will be passed to
ggplot2::scale_x_date()orggplot2::scale_x_datetime()asdate_minor_breaks. Only used inplot_timeline().- dateLabel
OPTIONAL. Character. A string giving the formatting specification for the labels. If the observed time is in date/datetime format, this value will be passed to
ggplot2::scale_x_date()orggplot2::scale_x_datetime()asdate_labels. Unavailable if the observed time is in numeric format. Only used inplot_timeline().- bg
OPTIONAL.
ggplotobject. If specified, plot onto this object. Unavailable inplot_timeline().
Details
if type is "def", the clustering results will be plotted spatially.
See also plot_def(). Available arguments:
resulttypeclusterignitionhotspotnoisefrom(OPTIONAL)to(OPTIONAL)bg(OPTIONAL)
if type is "mov", plot of the fire movement will be made.
See also plot_fire_mov(). Available arguments:
resulttypeclusterhotspotfrom(OPTIONAL)to(OPTIONAL)stepbg(OPTIONAL)
if type is "timeline", plot of the timeline will be made.
See also plot_timeline(). Available arguments:
resulttypefrom(OPTIONAL)to(OPTIONAL)mainBreak(OPTIONAL)minorBreak(OPTIONAL)dateLabel(OPTIONAL)
Examples
# \donttest{
# Time consuming functions (>5 seconds)
# Get clustering result
result <- hotspot_cluster(hotspots,
lon = "lon",
lat = "lat",
obsTime = "obsTime",
activeTime = 24,
adjDist = 3000,
minPts = 4,
minTime = 3,
ignitionCenter = "mean",
timeUnit = "h",
timeStep = 1)
#>
#> ──────────────────────────────── SPOTOROO 0.1.6 ────────────────────────────────
#>
#> ── Calling Core Function : `hotspot_cluster()` ──
#>
#> ── "1" time index = 1 hour
#> ✔ Transform observed time → time indexes
#> ℹ 970 time indexes found
#>
#> ── activeTime = 24 time indexes | adjDist = 3000 meters
#> ✔ Cluster
#> ℹ 16 clusters found (including noise)
#>
#> ── minPts = 4 hot spots | minTime = 3 time indexes
#> ✔ Handle noise
#> ℹ 6 clusters left
#> ℹ noise proportion : 0.935 %
#>
#> ── ignitionCenter = "mean"
#> ✔ Compute ignition points for clusters
#> ℹ average hot spots : 176.7
#> ℹ average duration : 131.9 hours
#>
#> ── Time taken = 0 mins 1 sec for 1070 hot spots
#> ℹ 0.001 secs per hot spot
#>
#> ────────────────────────────────────────────────────────────────────────────────
# Different types of plots
# Default plot
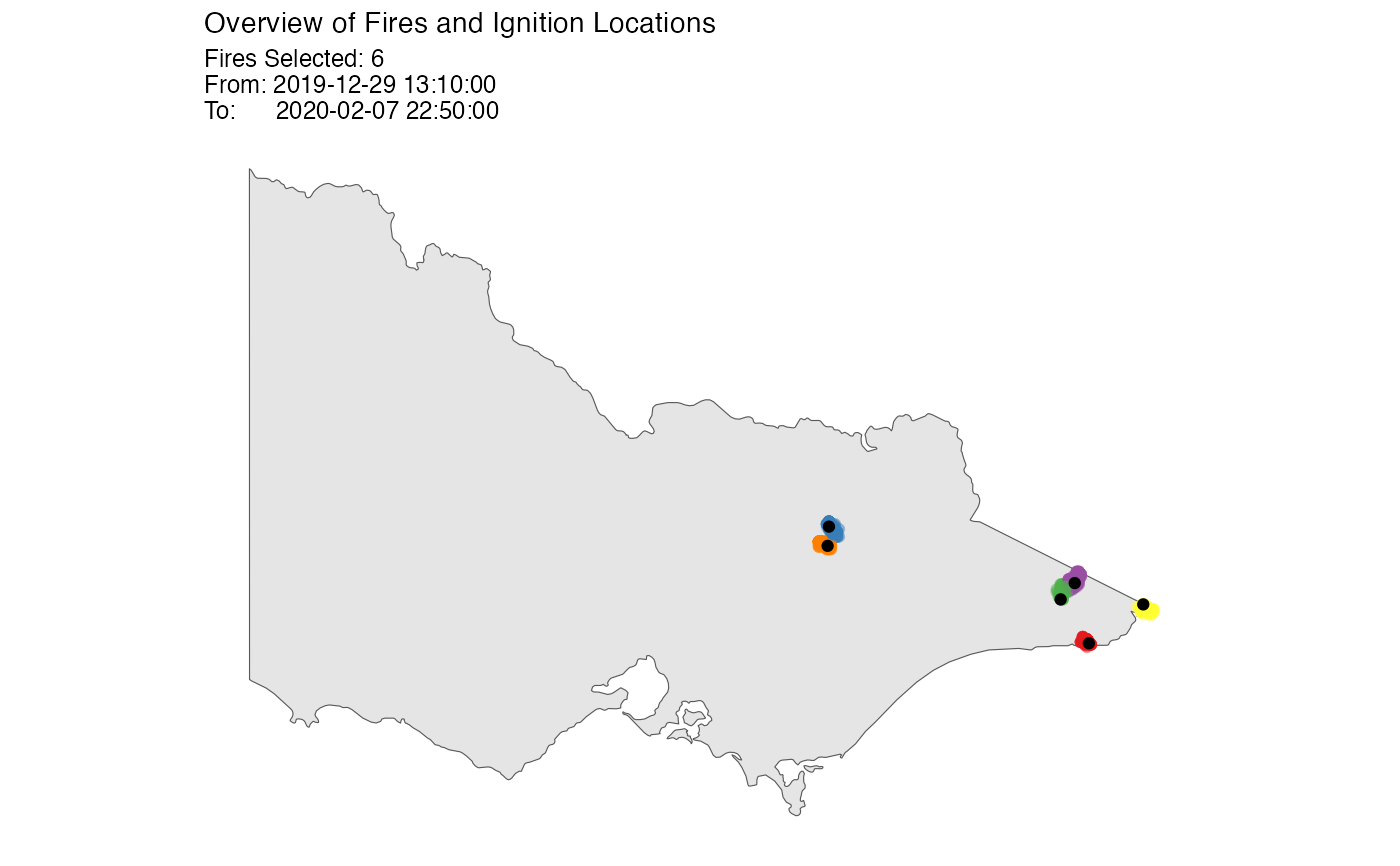
plot_spotoroo(result, "def", bg = plot_vic_map())
 # Fire movement plot
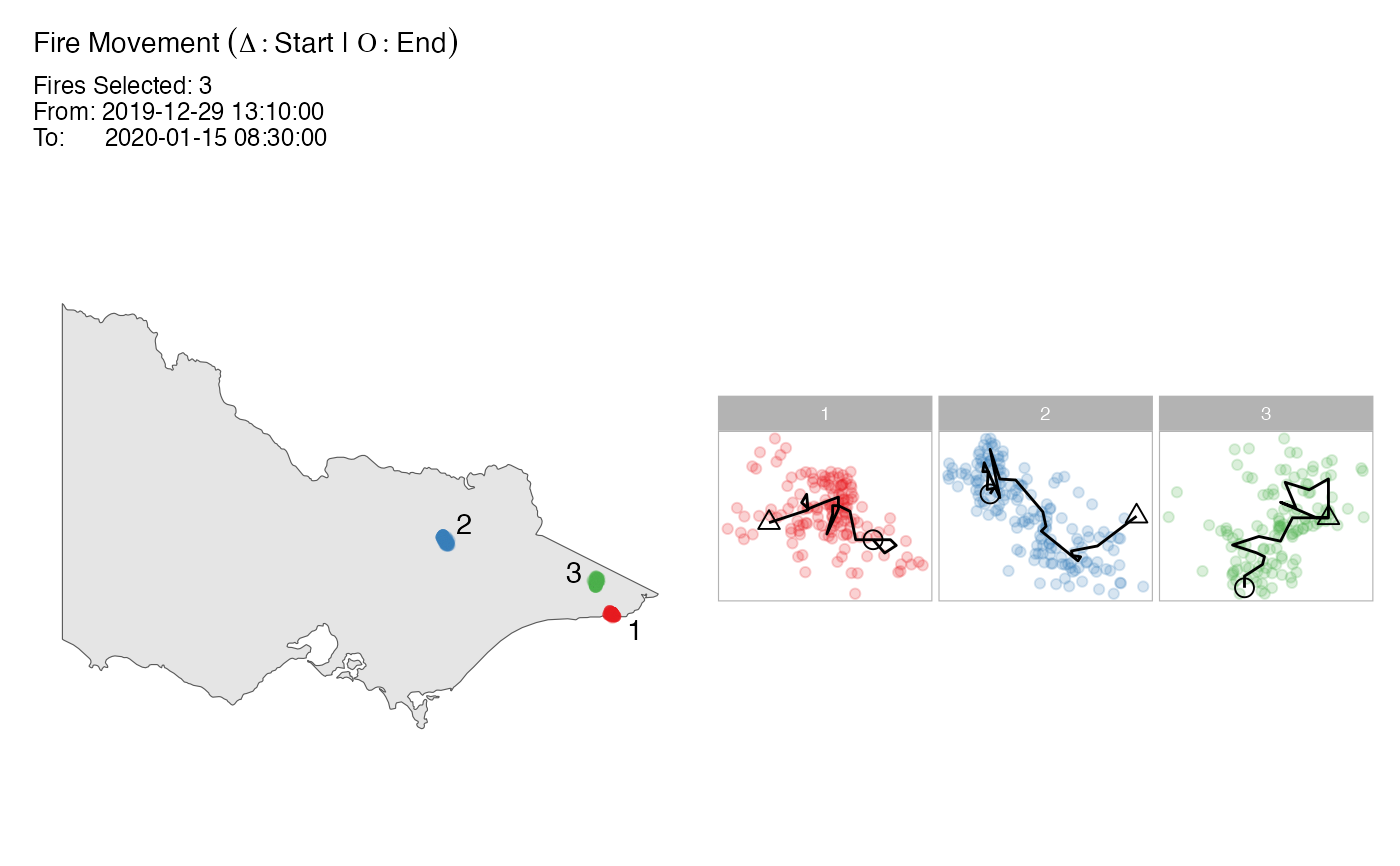
plot_spotoroo(result, "mov", cluster = 1:3, step = 3,
bg = plot_vic_map())
# Fire movement plot
plot_spotoroo(result, "mov", cluster = 1:3, step = 3,
bg = plot_vic_map())
 # }
# }