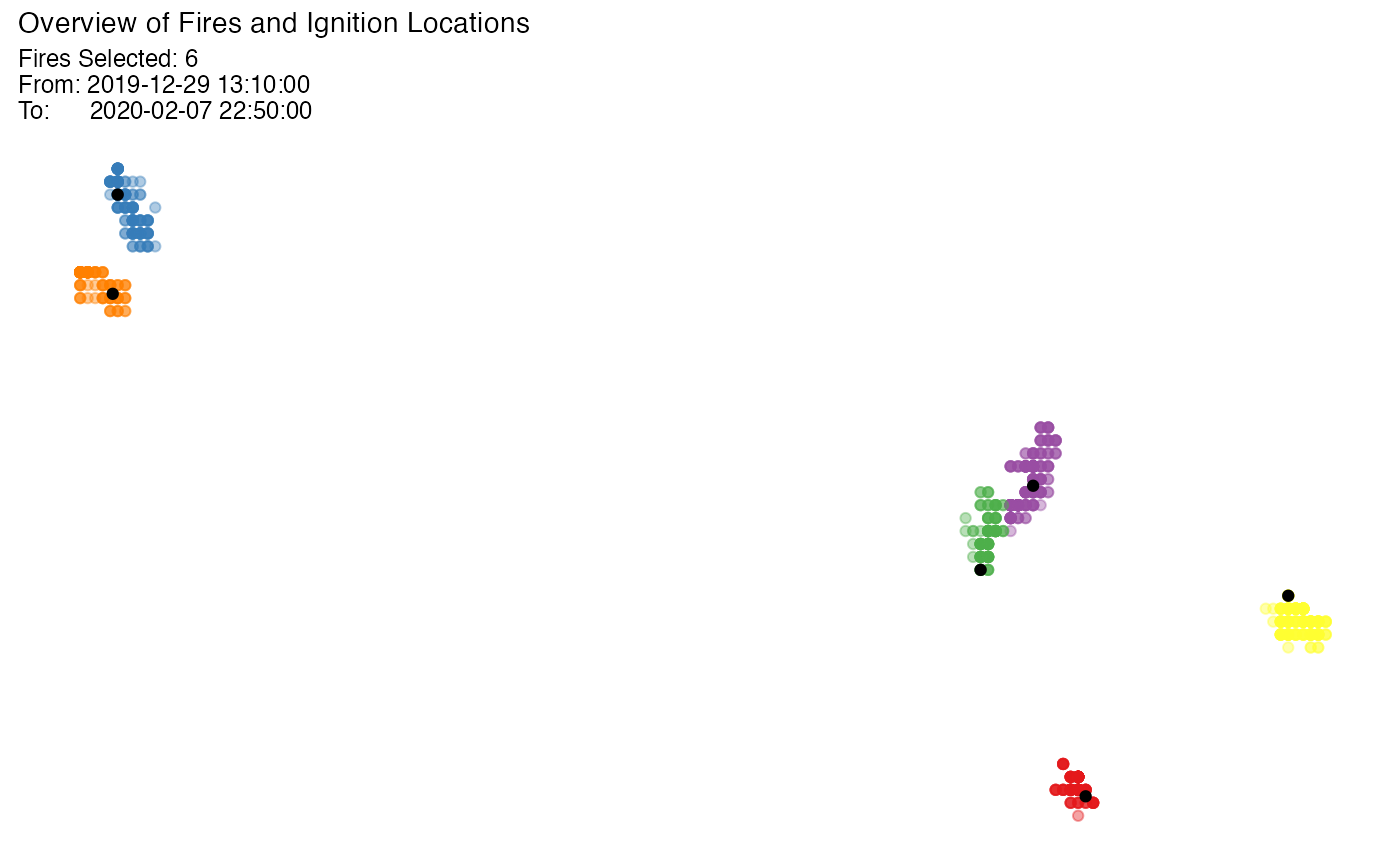
This function plots the clustering result spatially as a scatter plot.
Usage
plot_def(
  result,
  cluster = "all",
  hotspot = TRUE,
  noise = FALSE,
  ignition = TRUE,
  from = NULL,
  to = NULL,
  bg = NULL
)
Arguments
- result
spotorooobject. A result of a call tohotspot_cluster().- cluster
Character/Integer. If "all", plot all clusters. If an integer vector is given, plot corresponding clusters.
- hotspot
Logical. If
TRUE, plot the hot spots.- noise
Logical. If
TRUE, plot the noise points.- ignition
Logical. If
TRUE, plot the ignition points.- from
OPTIONAL. Date/Datetime/Numeric. Start time. The data type needs to be the same as the provided observed time.
- to
OPTIONAL. Date/Datetime/Numeric. End time. The data type needs to be the same as the provided observed time.
- bg
OPTIONAL.
ggplotobject. If specified, plot onto this object.
Examples
# \donttest{

  # Time consuming functions (>5 seconds)


  # Get clustering results
  result <- hotspot_cluster(hotspots,
                          lon = "lon",
                          lat = "lat",
                          obsTime = "obsTime",
                          activeTime = 24,
                          adjDist = 3000,
                          minPts = 4,
                          minTime = 3,
                          ignitionCenter = "mean",
                          timeUnit = "h",
                          timeStep = 1)
#>
#> ──────────────────────────────── SPOTOROO 0.1.6 ────────────────────────────────
#>
#> ── Calling Core Function : `hotspot_cluster()` ──
#>
#> ── "1" time index = 1 hour
#> ✔ Transform observed time → time indexes
#> ℹ 970 time indexes found
#>
#> ── activeTime = 24 time indexes | adjDist = 3000 meters
#> ✔ Cluster
#> ℹ 16 clusters found (including noise)
#>
#> ── minPts = 4 hot spots | minTime = 3 time indexes
#> ✔ Handle noise
#> ℹ 6 clusters left
#> ℹ noise proportion : 0.935 %
#>
#> ── ignitionCenter = "mean"
#> ✔ Compute ignition points for clusters
#> ℹ average hot spots : 176.7
#> ℹ average duration : 131.9 hours
#>
#> ── Time taken = 0 mins 1 sec for 1070 hot spots
#> ℹ 0.001 secs per hot spot
#>
#> ────────────────────────────────────────────────────────────────────────────────

  # Plot a subset of clusters
  plot_def(result, cluster = 1:3)


  # Plot all clusters
  plot_def(result, cluster = "all")

# }
# }