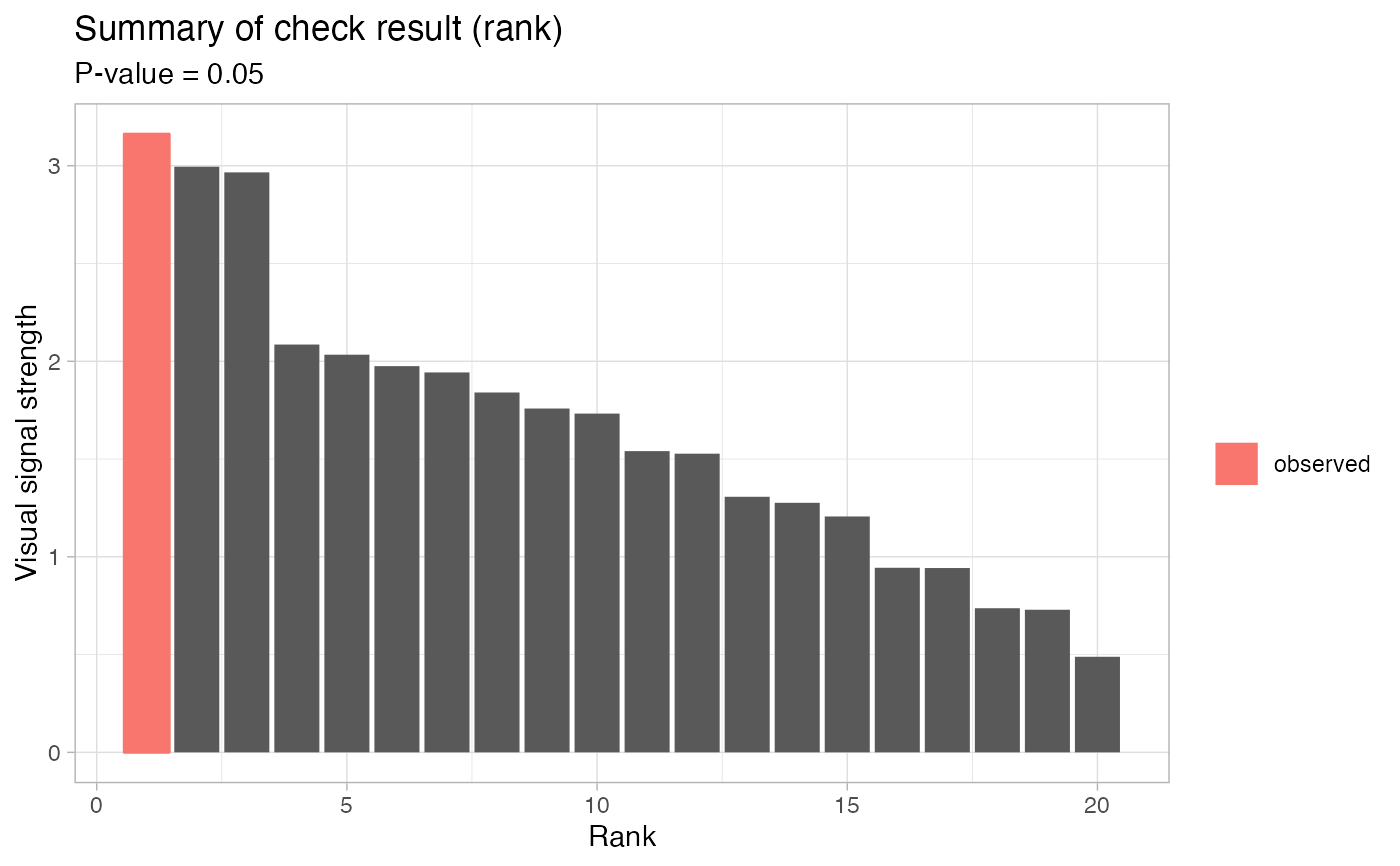
Draw a summary plot for the result
Source:R/zzz_auto_visual_inference.R
AUTO_VI-cash-summary_plot.RdArguments
- type
Character. Either "auto", "density" or "rank". Option "auto" will use the Boolean flag
self$check_result$lineup_checkto determine the correct option. See alsoAUTO_VI$summary_density_plot()andAUTO_VI$summary_rank_plot().- ...
Arguments passed to
AUTO_VI$summary_density_plot()orAUTO_VI$summary_rank_plot().
Examples
keras_model <- try(get_keras_model("vss_phn_32"))
if (!inherits(keras_model, "try-error")) {
  myvi <- auto_vi(lm(dist ~ speed, data = cars), keras_model)

  myvi$lineup_check()
  myvi$summary_plot()
}
#> ✔ Generate null data.
#> ✔ Generate null plots.
#> ✔ Compute auxilary inputs.
#> ✔ Predict visual signal strength for 19 images.
#> ✔ Predict visual signal strength for 1 image.