Draw a summary rank plot for the result
Source:R/zzz_auto_visual_inference.R
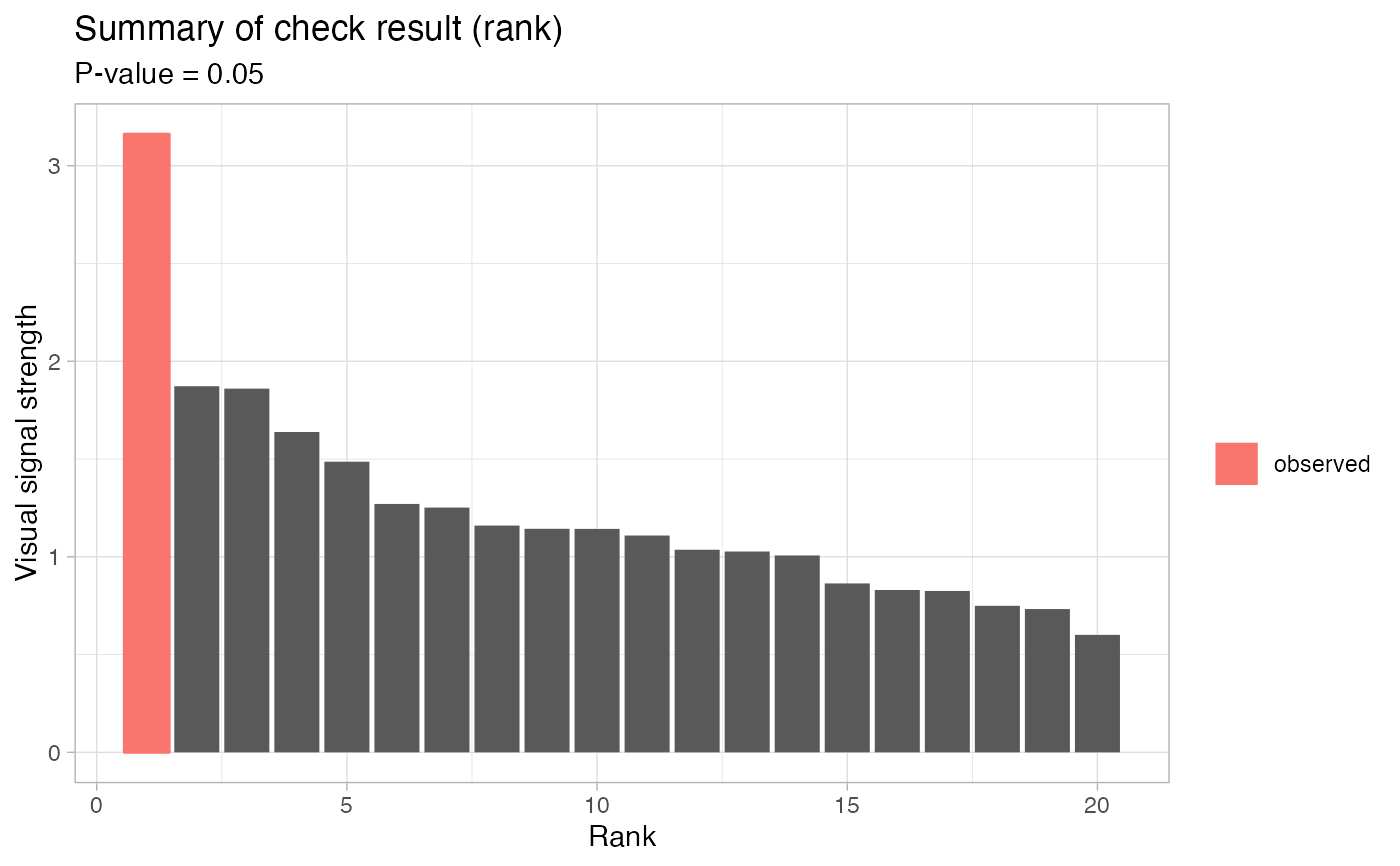
AUTO_VI-cash-summary_rank_plot.RdThis function draws a summary rank plot for the result.
Arguments
- vss
Numeric. Observed visual signal strength.
- null_dist
Numeric. Null visual signal strength.
- p_value
Numeric. P-value of the visual test. See also
AUTO_VI$p_value().
Examples
keras_model <- try(get_keras_model("vss_phn_32"))
if (!inherits(keras_model, "try-error")) {
  myvi <- auto_vi(lm(dist ~ speed, data = cars), keras_model)

  myvi$lineup_check()
  myvi$summary_rank_plot()
}
#> ✔ Generate null data.
#> ✔ Generate null plots.
#> ✔ Compute auxilary inputs.
#> ✔ Predict visual signal strength for 19 images.
#> ✔ Predict visual signal strength for 1 image.