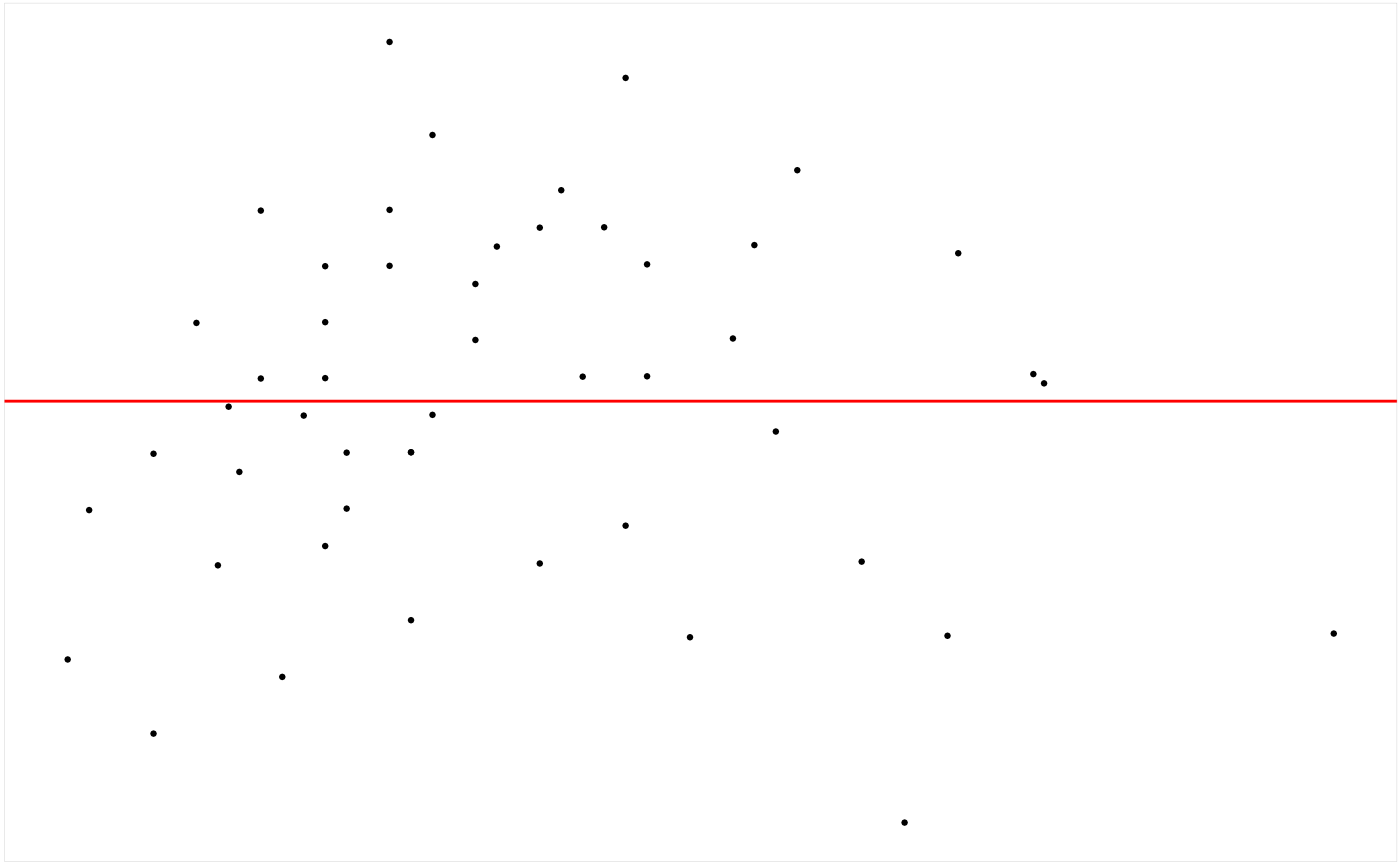
This function draws a standard residual plot.
Arguments
- data
Data frame. A data frame containing variables
.residand.fitted. See alsoAUTO_VI$get_fitted_and_resid().- theme
ggtheme. Aggplottheme object. See alsoggplot2::theme_light().- alpha
Numeric. Alpha of dot. Value between 0 and 1.
- size
Numeric. Size of dot. Value between 0 and 1.
- stroke
Numeric. Stroke of dot. Value between 0 and 1.
- remove_axis
Boolean. Whether or not to remove the axis.
- remove_legend
Boolean. Whether or not to remove the legend.
- remove_grid_line
Boolean. Whether or not to remove the grid lines.
- add_zero_line
Boolean. Whether or not to add a zero horizontal line.
