Draw a summary Plot for principal component analysis conducted on extracted features
Source:R/zzz_auto_visual_inference.R
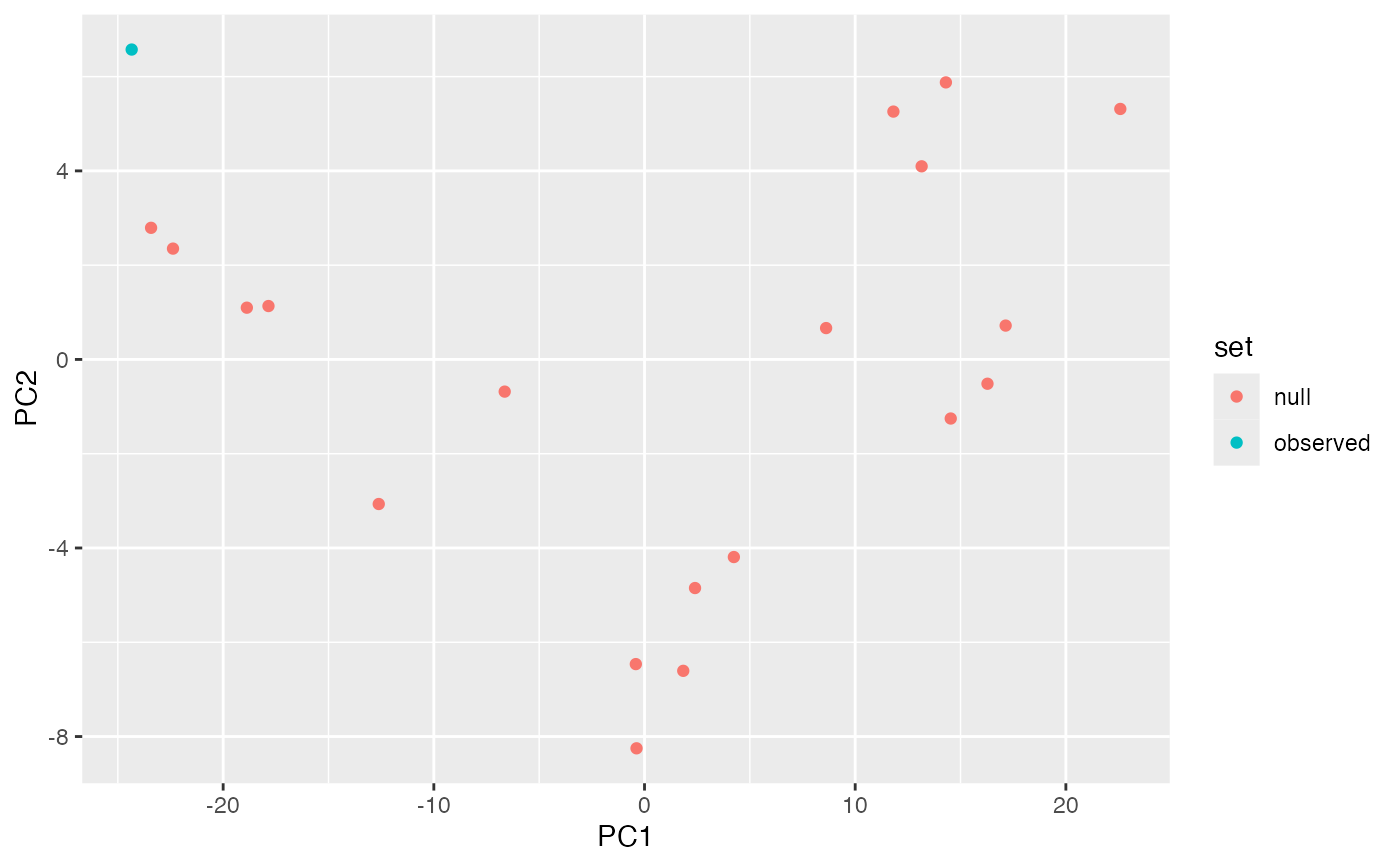
AUTO_VI-cash-feature_pca_plot.RdThis function draws a summary Plot for principal component analysis conducted on extracted features
Arguments
- feature_pca
Dataframe. A data frame containing the rotated features.
- x
Symbol. The x variable. See also ggplot2::tidyeval.
- y
Symbol. The y variable. See also ggplot2::tidyeval.
- col_by_set
Boolena. Whether to color points by sets (observed, null, and boot).
Details
By default, it will visualize PC2 vs PC1. User can choose to visualize other principal components.
Examples
keras_model <- try(get_keras_model("vss_phn_32"))
if (!inherits(keras_model, "try-error")) {
  myvi <- auto_vi(lm(dist ~ speed, data = cars), keras_model)

  myvi$lineup_check(extract_feature_from_layer = "global_max_pooling2d")
  myvi$feature_pca_plot()
}
#> ✔ Generate null data.
#> ✔ Generate null plots.
#> ✔ Compute auxilary inputs.
#> ✔ Predict visual signal strength for 19 images.
#> ✔ Predict visual signal strength for 1 image.